Changing electricity supplier is theoretically easy, for two reasons:
- changing supplier is always free,
- there are no penalties for leaving the previous supplier.
After all, there are few reasons why you might decide to change supplier: customer service is unresponsive or, even worse, the bill is too high.
The churn rate in the utility sector is not to be taken lightly. The annual average of users changing energy and water supplier is between 12 and 15%, and the trend is not declining1.
But we can't live our lives without electricity, gas and water, and those 12–15% of users will have to switch to a new supplier. But how many clicks does it take to make the change? How easy is the process? And given the current situation: is it possible to complete the whole procedure online? As in every #ClickChallenge, we asked our Crowd of real users and testers to help work this out.

The click count
In the week between 19 and 26 May, together with our community of testers, we requested a change of electricity supplier on the websites of 18 companies, counting the number of clicks necessary to achieve the goal.
The 18 companies were: A2A, Acea, Edison, Enel, Engie, Eni, Eon, Green Network Energy, Heracomm, Illumia, Iren, Pulsee, Sorgenia, Tate, Vivigas Energia, WeKiwi, WithU.
In particular, of the 17 analysed, five are digital native (Illumia, Pulsee, Tate, WeKiwi, WithU), while the others are traditional.
As always, before we reveal the results, some clarifications are necessary:
- all the processes of each brand were full digital (no human intervention, or similar, was needed);
- clicks were counted starting from the homepage of each website (once the tester has found the fastest way to complete the goal);
- the click count ended at the last possible step before sending the documents;
- the testers did not follow through with the change of supplier (see point above);
- all reported results (i.e. both clicks and the other variables we will introduce in the next paragraph) are the average of the results of several testers;
- The completion of the individual master fields was counted as one click. Clicks for selecting possible form-filling suggestions were not counted;
- only clicks for filling out mandatory data were counted;
- the research does not take into account the time taken to reach the goal.
Not only clicks: other metrics to evaluate user experience
Before showing the results, let's make another clarification. As we repeat in all #ClickChallenges, the number of clicks is by no means a complete metric to measure the usability (much less the User Experience) of a site. For this reason, the click count was combined with questionnaires intended to evaluate:
- satisfaction
- usability
- design
- information capacity (hereinafter Informativity)
- reliability
To do this, we asked our testers these questions:
- Do the features of the website meet my needs?
- Was the website easy to use?
- Is the graphic design appropriate for the website?
- Does the site provide accurate information?
- Do I feel safe completing the switch on this site?
This is because, as we have also explained in the previous #ClickChallenges, a higher number of clicks does not necessarily mean a lower quality of user experience. For example, in the Spanish bank challenge, the bank with the highest number of clicks was also the one with the lowest perceived level of difficulty.
Having said that, we can finally unveil the results.
Research results
First of all: all of the websites in the research would allow users to change the supplier online.
Let's start with traditional companies.
Already at a glance, in the graph below, we can see how the number of clicks and user satisfaction, for example, are not necessarily linked. In fact, the supplier with the most clicks and the one with the fewest clicks got the same satisfaction score.
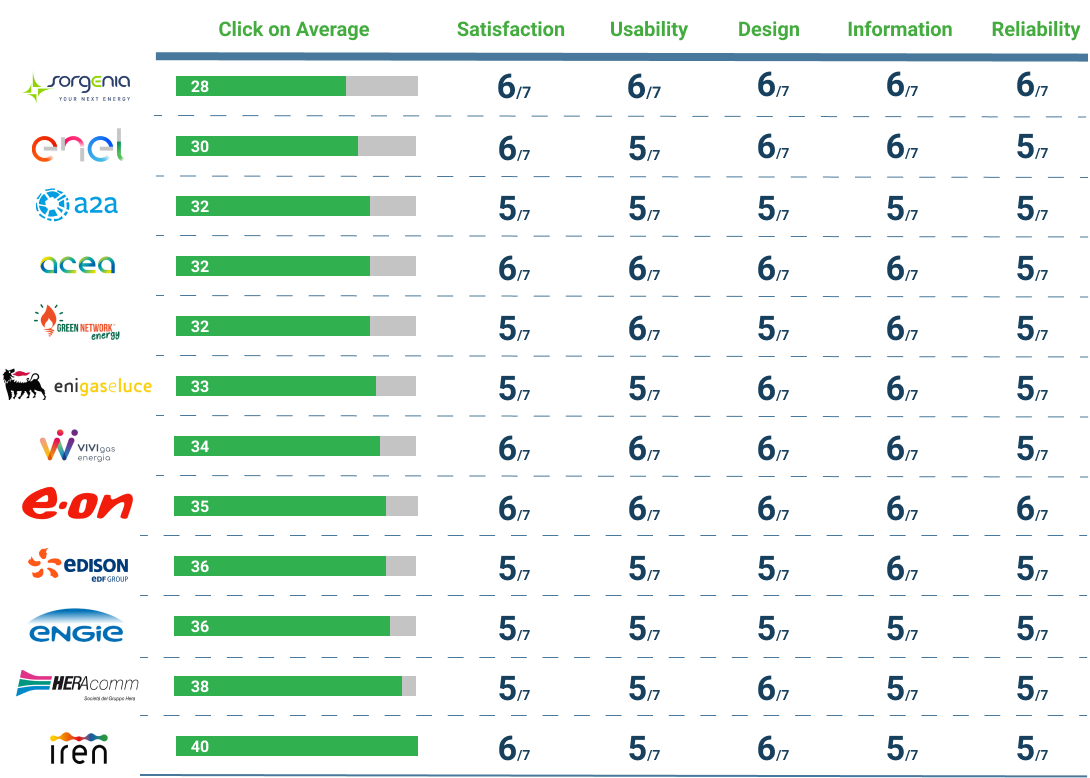
Regardless of clicks, ratings are consistent across all brands for all metrics. No company received the highest possible score, but all 12 traditional companies scored high (minimum 5 out of 7 points). By the way, let's make a brief note: the scale in sevenths is used because it is typical of user experience research.
The average number of clicks our testers counted was 33.8. As for the other five metrics, design scored the highest on average (5.7 out of 7). The metric that suffered the most was reliability, which averaged 5.2.
A separate discussion must be held for fully digital companies. Those who expected higher scores than the traditional ones were wrong. Let's take a look at the results:
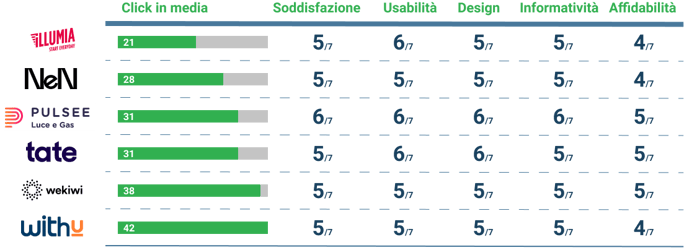
On average, digital companies overtake traditional ones only in terms of usability and fewer clicks.
In fact, the number of clicks did not make as big a difference as one might think: 33.8 on average for traditional and 29.8 for fully digital. Reliability represents the widest gap between traditional and digital native. Traditional companies, in fact, are perceived as more trustworthy than digital-native ones: 5.2 vs 4.5. All the other metrics, on the other hand, do not show significant differences between fully digital and traditional.
Of the 18 companies, seven allow you to upload a bill to simplify data entry (similar to the procedure whereby, for example, in eCommerce, you can register through social networks). Of these seven, three are fully digital (Illumia, Pulsee, WeKiwi) and three traditional (Sorgenia, Enel, Edison). Here again, we see that there is no clear-cut difference between the two categories.
Conclusions
We say it again with every Click Challenge: the number of clicks to reach the goal is not comparable to the depth of a usability test or a Ux test. This can also be seen in the metrics we have selected, which show that experience building is far more complex than a click-through process.
This research aims to raise awareness among Italian (and other) companies about the usability, UX, speed and user-friendliness of their digital properties.
In order to improve the churn rate we were talking about at the beginning of the research, it is necessary to analyse the entire Customer Journey and not just a section of it (as we have done in this case). As always, AppQuality is available to all those companies that want to build fluid and customer-centric products. To do so, it includes real users of the service in the design, development and validation processes: crowd testing.
-1.png?width=1216&height=346&name=gdo%20(2)-1.png)
Notes
1 Doxaa
2 A2A, Acea, Edison, Enel, Engie, Eni, Eon, Green Network Energy, Heracomm, Illumia, Iren, Pulsee, Sorgenia, Tate, Vivi Energia, WeKiwi, WithU